Optimist Charts
* * * Notice * * *
Although the source for the data presented in these charts is believed to be accurate, the possibility always exists that some of the data may be displayed incorrectly. The lines and other information drawn on the charts reflect only the Optimist's personal perspective, and that information will be changed as circumstances dictate. Please do not make any investment decisions or base any investment actions on the data, the lines, or any other information presented on these charts. These charts are not intended to be investment advice, and the Optimist cannot assume any liability for any investment decisions the reader chooses to make or to not make. Cheers!
Optimist chart philosophy: I try to keep my charts simple and uncluttered to make it easier to see the big picture without being distracted by too many details which frequently do little more than amplify the short term noise. I present 10 year monthly bar charts of the precious metals to better show the long term view, in addition to the 3 year weekly bar and the 1 year daily bar charts for a zoom to the present. Using the longer term charts to draw appropriate channels makes it much easier to see if the current prices are close to a buy zone near their lows, or to a sell zone near their highs. My charts help me to decide whether I should be buying low, or selling high, or doing nothing in between. I hope my charts are useful for you too. Cheers!
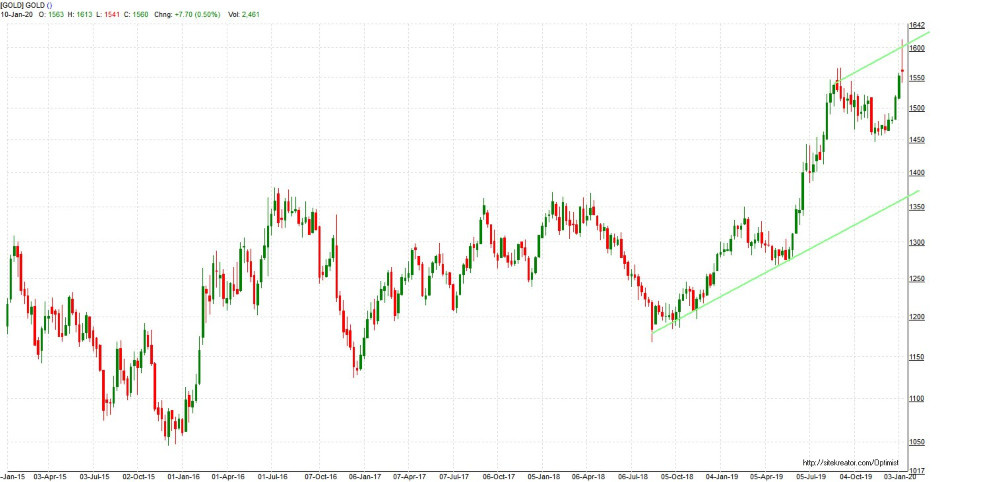
Gold updated weekly
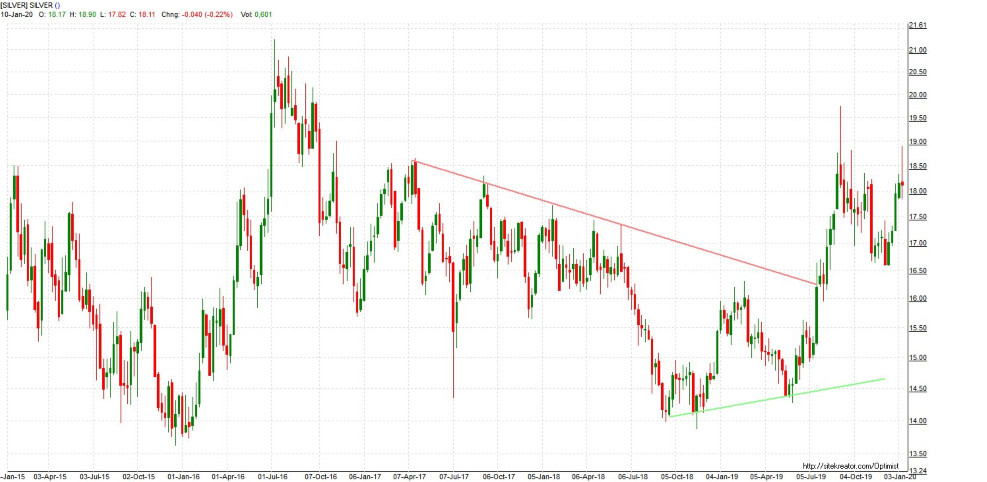
Silver Updated weekly
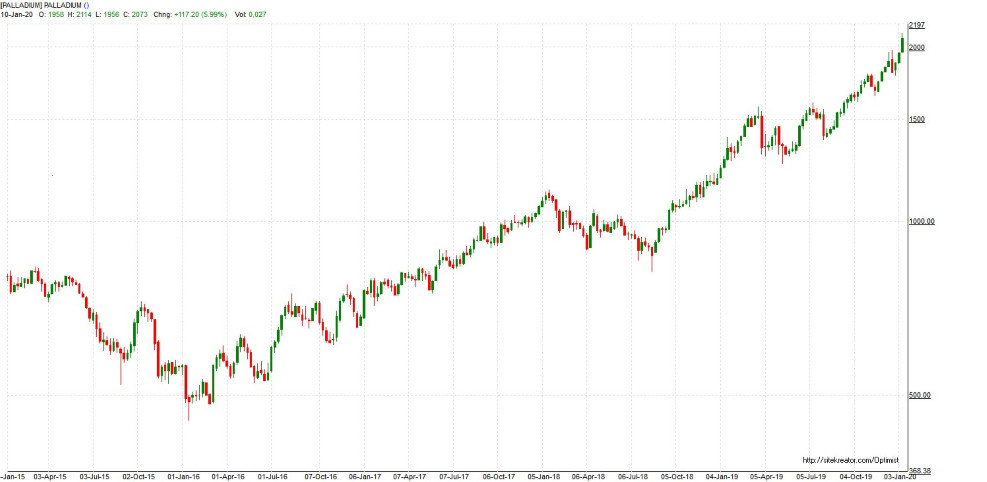
Palladium Updated weekly

Silver monthly through date at top left
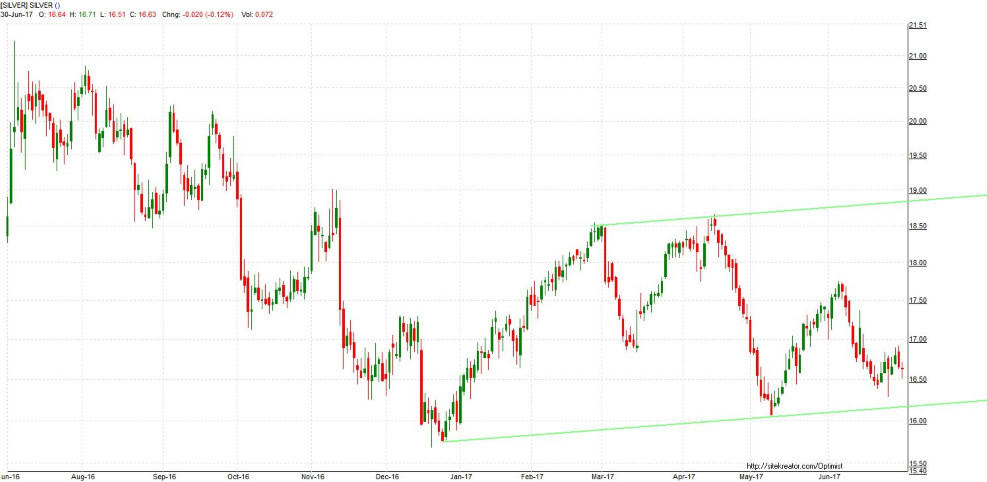
Silver weekly through date at top left
Silver daily through date at top left
Gold monthly through date at top left
Gold weekly through date at top left
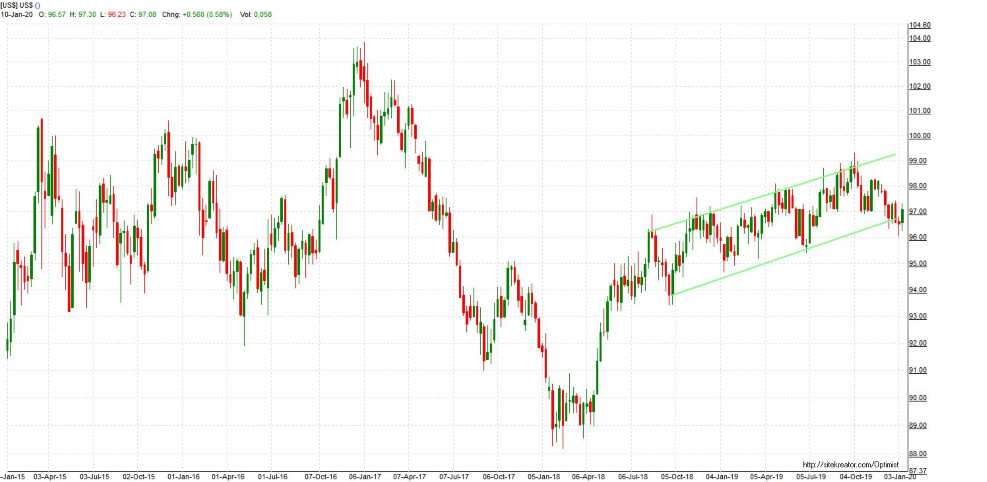
US$ Updated weekly
Note: The above charts plot the most active futures contract.
Other Optimist Charts
MoreAG Index, MoreAU Index, and MoreCu Index:
The
value of silver
when measured against all paper currencies continues to trend higher. This link offers more information about the MoreAG Index and a longer term monthly chart.
Click this link to open the weekly chart of the MoreAG Index.
The
value of gold
when measured against all paper currencies continues to trend higher.This link offers more information about the MoreAU Index and a longer term monthly chart.
Click this link to open the weekly chart of the MoreAU Index.
The
value of Light Crude Oil
when measured against all paper currencies continues to trend higher.Oil, Silver, and Gold are stronger than the Weak Dollar offers more information about the MoreOil Index.
Click this link to open the monthly and weekly charts of the MoreOil Index.
The ratio of silver divided by copper gives an insight into the
time when silver may explode
.This link offers more information about the MoreCu Index.
Click this link to open the weekly chart of the MoreCu Index.
The
ratio of silver divided by gold
provides another view of the precious metals bull market.Click this link to open the weekly chart of the Ag/Au Ratio
The link below offers additional background about the Ag/Au Ratio:
Could Silver Cost More Than Gold?
Silver and Gold Open Interest:
The open interest of silver and gold (reported through the end of the previous week) continues to trend higher.
Click this link for more perspective on silver and gold open interest.
This link is an updated weekly chart of Silver open interest.
This link is an updated chart of Gold open interest.
Recent Optimist Commentaries:
The Silver Two Year Cycle Continues (published 6/30/12)
The Half Percent Solution to the USA Financial Problems
(published 6/08/12)Viewpoints (1/02/2010 to present)
Highest Gold Value Ever (1/01/09)
Buy Silver and Gold. The dollar doesn’t matter! (8/14/08)
Oil, Silver, and Gold are stronger than the Weak Dollar (5/30/08)
Buying Silver When There is None Left to Buy (3/24/08)
An Optimist gets no respect (3/06/08)
Buy the Silver Sidestep for Super Profits (7/11/07)
Could Silver Cost More Than Gold? (12/21/06)
A Sure Thing Silver Cycle? (12/01/06)
An Obscene Breach of Trust (10/12/06)
Silver to the People ! (8/17/06)
SIlver and gold cornucopia (6/28/06)
Silver and gold are better than paper (6/07/06)
Silver as an Investment? (5/24/06)
Silver is Only Second Best (5/16/06)
Deflatuation in Silver and Gold (4/12/06)
Is Silver or Gold Better? (2/21/06)
Reader contributions are welcome, and
excerpts will be added to this presentation.
Please send comments or suggestions to the Optimist:
Email: